Table of Contents
System status
Introduction
This tool reports on the user-selected YCE server and includes details on its setup, the various daemons and processes and some additional details. The System status tool will also allow users to stop and start the YCE daemons.
The tool is accessible for any user with the global ‘Manager’ permissions and is located in the Admin menu by the name “System”.
The report is divided into six sections:
- YCE Server setup
- YCE processes
- Database status
- Filesystems
- YCE process list
- YCE usage
Each of these sections lists some relevant details on the YCE server selected.
Operation
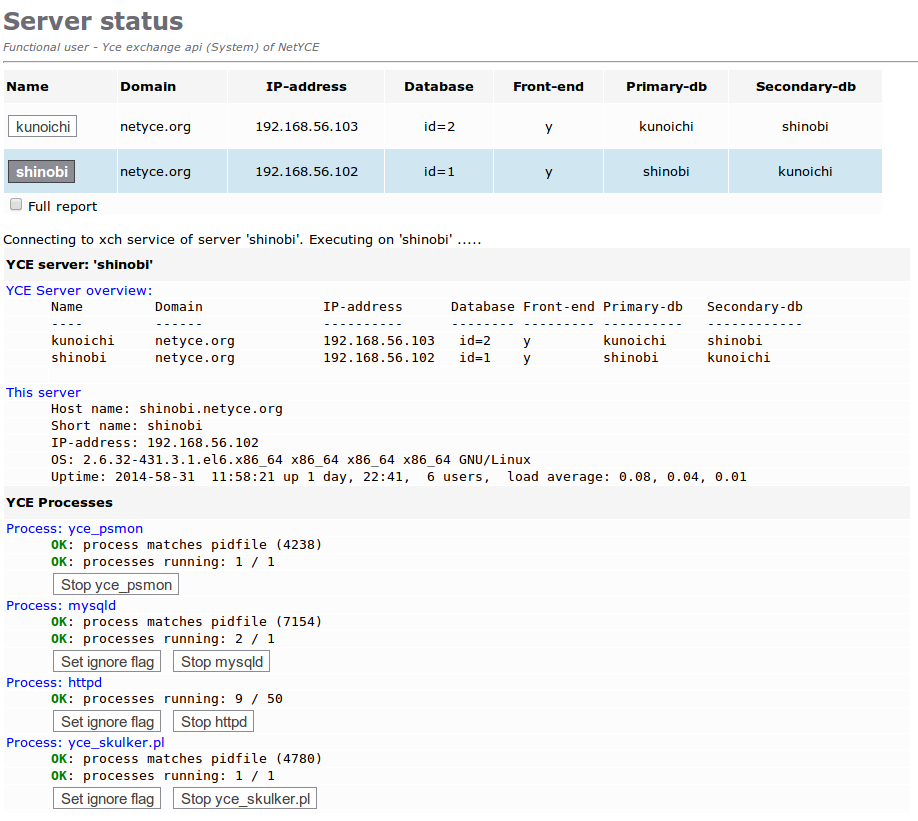
When the tool is initially started, a header list is shown with the various YCE servers along with their details. The server name forms a button to select the server to report on. The default server selected is always the current (front-end) server the user is working on. To highlight the current selected server, the background color for this server details is a lighter blue.
Following the header is a line with connection details to illustrate the connection status to the selected server. The connection uses the ‘Yce exchange service’ that is normally active on all YCE servers.
When the connection succeeds, the connection line is followed by the report, each section preceded by a bold header. Subsections are preceded by a header in blue text.
Each section is described in the following paragraphs.
Connection details
The line with connection details informs the user of the status of his request. All requests are issued over the YCE exchange interface, an xml based synchronous request-response system between all YCE servers.
The process serving this interface (yce_xch) is therefore a prerequisite for both the system report and its actions. The connection details line informs the user on the availability and connectivity of the yce_xch service.
When the service or server cannot be reached, the connection line shows this status:
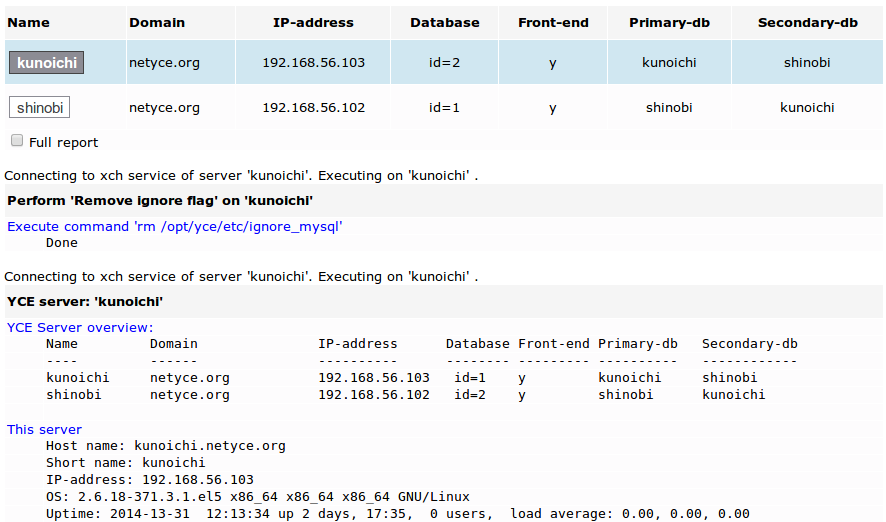
When performing actions (using the buttons embedded in the report), the action is executed using the same method of connecting, executing and reporting. When done, the system status report is requested automatically and appended.
YCE Server setup
The first section in the report has two subsections: the server overview and the current server details.
YCE overview
The server overview should correspond to the header of the page. In fact, it will match exactly for the local server (the front-end server the user is using) since they are both taken from the same source: the yce configuration file for the server /opt/yce/etc/<hostname>_yce.conf.
This file is created by the setup tool during system configuration /opt/yce/system/mk_config.pl and should be updated when configuration changes are made in the YCE server setup (hostname, ip-address, servers, roles). This setup tool can create the config files for all servers simultaneously, but it can also be executed on each system in turn.
It is essential however, that all servers have the same ‘view’ of the YCE environment. If the page header shows a different setup than the report, the configuration setup should be corrected for the erroneous server, or preferably all servers.
Keep in mind that the page header is taken from the local server configuration file.
This server
This subsection shows the hostname, short name and ip-address of the server as retrieved using the hostname command using the options -f, -s and -i sequentially. The system uses these results in various places and should be correct.
One line describes the (Linux Red Hat) OS. The output of the command
uname -rmpoi is shown.
The final line in this section is the output form the uptime command. It lists the current date, time and up-time along with the number of user sessions (shell logons) and load averages. These load averages are an indication of how busy the server was over the last 1, 5, and 15 minutes. These numbers give the average number of processes waiting for execution. Numbers exceeding the number of processors normally indicate the system might be perceived as slow to respond.
YCE processes
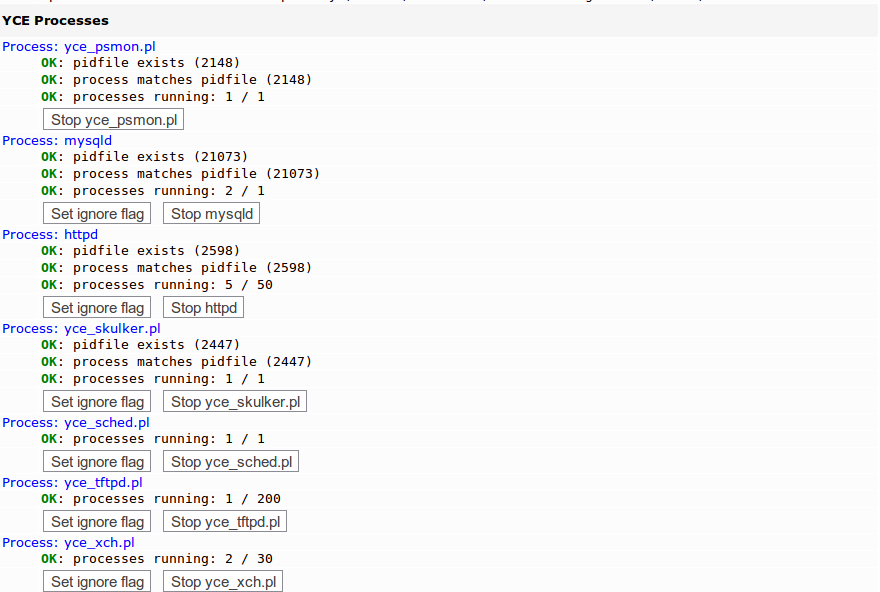
This section will probably the most consulted section since it will validate the running YCE daemons. The report uses a subsection per daemon to show its status, its matching pid-file (for locking purposes) and the number of childs included with the daemon. Each line is preceded by a validation remark: OK:, WARN:, or ERROR: in appropriate colors.
In addition to the status lines, buttons can be shown to manipulate its operation.
YCE daemon configuration
Before elaborating on the action these buttons represent, some background information is required on the configuration of the YCE daemons.
When the configuration setup script is executed /opt/yce/system/mk_config.pl, it collects, amongst others, from the user the role of each YCE server. A server can either be a front-end server or a database server. Up to two database servers and seven front-end servers can be configured. Each requiring a primary and secondary database source.
When completed, configuration files for all servers are generated. Amongst these configuration files some are named <hostname>_psmon.conf. The psmon.conf file with the matching hostname defines the YCE daemons that will be required for that server in its defined role.
It is this configuration file that is being used to determine the YCE daemon statuses.
- hostname_psmon.conf file
# YCE psmon configuration
#
#------------------------------------------------------------
# filename: 'shinobi_psmon.conf'
# PSmon config for 'shinobi.netyce.org'
#
#
# YCE Server overview:
# Name         Domain               IP-address      Database Front-end Primary-db   Secondary-db
# ----         ------               ----------      -------- --------- ----------   ------------
# kunoichi     netyce.org           192.168.56.103   id=2    y         kunoichi     shinobi
# shinobi      netyce.org           192.168.56.102   id=1    y         shinobi      kunoichi

#
# File created by 'mk_config.pl' at 2013-12-06 15:21:47  on 'shinobi.netyce.org'
#------------------------------------------------------------
#
<Process mysqld>
    disabled    false
    ignoreflag  /opt/yce/etc/ignore_mysql
    spawncmd    /usr/bin/sudo /sbin/service mysql start
    killcmd     /usr/bin/sudo /sbin/service mysql stop
    pidfile     /var/opt/mysql/mysql.pid
    instances   1
    pctcpu      90
    noemail     False
</Process>
<Process httpd>
    disabled    false
    ignoreflag  /opt/yce/etc/ignore_httpd
    spawncmd    /usr/bin/sudo /sbin/service httpd start
    killcmd     /usr/bin/sudo /sbin/service httpd stop
    pidfile     /var/run/httpd/httpd.pid
    instances   50
    pctcpu      90
    noemail     False
</Process>
<Process yce_skulker.pl>
    disabled    false
    ignoreflag  /opt/yce/etc/ignore_skulker
    spawncmd    /opt/yce/system/init/yce_skulker start
    killcmd     /opt/yce/system/init/yce_skulker stop
    pidfile     /var/opt/yce/logs/yce_skulker.pid
    instances   1
    pctcpu      90
    noemail     False
</Process>
<Process yce_sched.pl>
    disabled    false
    ignoreflag  /opt/yce/etc/ignore_sched
    spawncmd    /opt/yce/system/init/yce_sched start
    killcmd     /opt/yce/system/init/yce_sched stop
    instances   1
    pctcpu      90
    noemail     False
</Process>
<Process yce_tftpd.pl>
    disabled    false
    ignoreflag  /opt/yce/etc/ignore_tftpd
    spawncmd    /usr/bin/sudo /opt/yce/system/init/yce_tftp start
    killcmd     /usr/bin/sudo /opt/yce/system/init/yce_tftp stop
    instances   200
    pctcpu      90
    noemail     False
</Process>
<Process yce_xch.pl>
    disabled    false
    ignoreflag  /opt/yce/etc/ignore_xch
    spawncmd    /opt/yce/system/init/yce_xch start
    killcmd     /opt/yce/system/init/yce_xch stop
    instances   30
    pctcpu      90
    noemail     False
</Process>
<Process yce_ibd.pl>
    disabled    true
    ignoreflag  /opt/yce/etc/ignore_ibd
    spawncmd    /opt/yce/system/init/yce_ibd start
    killcmd     /opt/yce/system/init/yce_ibd stop
    instances   1
    pctcpu      90
    noemail     False
</Process>

Frequency       20
Disabled        False
AdminEmail      yce@localhost
The syntax of the file is straightforward. Xml-style process definitions with several attribute / value pairs. YCE processes not required for the server role have the disabled attribute set to true. Other attributes define the start and stop commands, the location of a pid-file, if any, and the name and location of an ignoreflag.
More on these ignore-flags in a moment. First you will need to understand how this file is used by the service manager: the psmon-daemon.
Service manager
At system startup the YCE service manager /opt/yce/bin/yce_psmon is started (as root!). It reads the YCE daemon configuration file /opt/yce/etc/<hostname>_psmon.conf and launches any required daemon not yet running. The spawncmd attributes tell it how. From that moment on, the psmon-daemon will wake up every 20 seconds (the ‘frequency’ attribute) and verify all daemons operate within their parameters (pctcpu, instances, pidfile).
When needed a process is restarted automatically or taken down if misbehaving. Essentially, the psmon-daemon is the YCE service manager of the server.
To ensure the psmon-daemon is permanently running, it is added to the ‘root’s crontab to relaunch it every hour.
Ignore flags
For maintenance purposes a process must be temporary stopped before restarted. To prevent the restart to take place before the user or maintenance task is ready, the service manager needs to be informed that a process should not be monitored. This is achieved by setting an ignore-flag for the appropriate process.
While this ignore-flag exists, the service manager will not touch this process or its siblings. When the daemon dies, it its not automatically relaunched. The various ignore-flag files are all located in the /opt/yce/etc/ directory and are named ignore_<process>.
The standard procedure for maintenance on an YCE daemon is therefore: create the ignore-flag file, stop the daemon, perform the maintenance task, remove the ignore-flag. The service manager will then start the daemon automatically within the next 20 seconds.
If a daemon must be restarted without additional maintenance tasks, it suffices to stop the daemon and wait a few seconds to make it come back.
To facilitate these procedures, the YCE processes report includes buttons to Set or Remove the ignore flag per daemon. Once set, the report will list a warning for its presence.
Notes on process operations
Some actions provided by the buttons in this section have limitations or repercussions. Those are listed below.
yce_tftp
The YCE tftp daemon serves its users on port 69. It requires ‘root’ privileges to be able to bind to these low port-numbers. Therefore, stopping the yce_tftp process is executed as expected when using the provided button, but it cannot be started that way!
Using the button Start yce_tftp will not have the desired effect since it will execute the command as the ‘yce’ user, not ‘root’. To start the yce_tftp server, you have to rely on the service manager.
To restart the yce_tftp processes, use the Stop button and then wait for it to come back.
yce_xch
The yce_xch daemon is used as a north-bound interface for NMS systems, but also for inter-server tasks of the YCE system itself. One of these is the execution of the system status report and its additional actions. The yce_xch daemon must be running in order to execute these tasks, even when running on the local server!
Setting the yce_xch ignore-flag and then killing the yce_xch daemon will remove this server from remote management using this tool. Only by removing the ignore flag using a shell session can the situation be corrected.
Database status
The Database status section has four subsections.
DSN
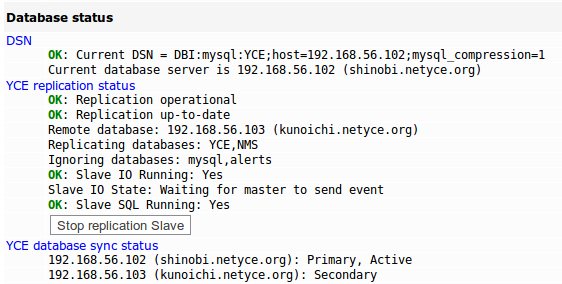
The first, lists the current data source name (DSN) as used by the server. It contains amongst others the IP-address of the database server. The DSN is read from the file /var/opt/yce/jobs/DSN.dat, which is maintained by the yce_skulker daemon.
The yce_skulker is tasked with the monitoring of the database availability and synchronization status of the YCE master/master database setup. When the primary database fails, it updates the DSN to the secondary within 10 seconds or at the first database-request. On the return of the primary database, the automatic re-synchronization is monitored, and once completed, the DSN restored to the primary as well.
Replication status
The lines in this subsection tell the status of the master/master database replications. Both databases are master to the other and slave ass well. Replication is configured on the database directly. If it is configured, various details on which databases are included or excluded are listed.
The status of the IO state and SQL state are given separately, but both need to be running to get an active replication status. Additional information is listed when failure is detected and can include the offending SQL statement in case of a replication conflict.
Database sync status
The database sync status gives the result of the yce_skulker interpretation of its continuous synchronization tests. It lists the primary and standby database IP-addresses and wich of these is the current active database for this server.
License status
YCE licenses come in two varieties, the package licenses and the activation licenses. The latter are listed here along with their status as monitored by the yce_skulker.
Sample database states
When either database can be up, down, active or inactive, tracing the corrective action can be confusing. The example below clarifies the messages listed when one database is down and the other operational.
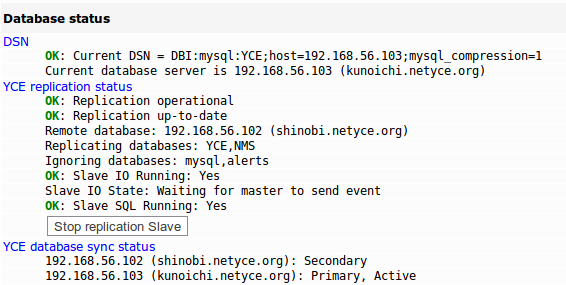
In this example the primary database for the ‘shinobi’ server is brought down (eg for backup purposes). This causes ‘shinobi’ to switch to the database on ‘kunoichi’, which lost its master and gets out of sync.
Step 0: all’s well Shinobi's status:
Kunoichi's status:
Step 1: stop ‘shinobi’ database Set the ignore-flag,
Then stop the mysqld database
You get an error because the database cannot verify you are a valid user for the system status report. The database is gone and the switch has not yet occurred.
Request the report again from ‘shinobi’. The processes show the missing mysql database process:
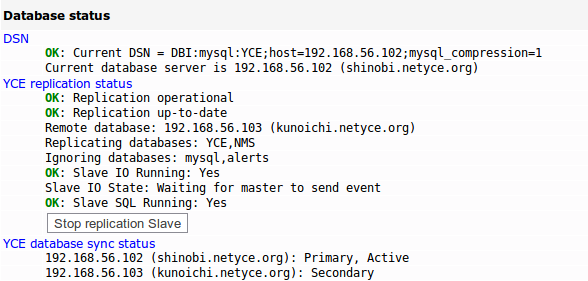
The database status on ‘shinobi’ shows it runs on ‘kunoichi’ now.
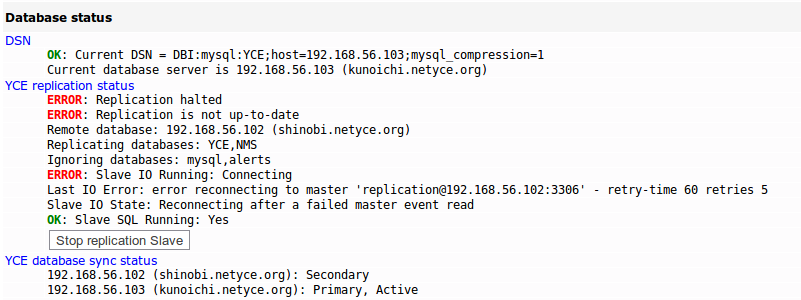
Step 2: review ‘kunoichi’ database Request the report for ‘kunoichi’. It shows a database replication status with errors:
The first error alerts that the replication was halted. Its remote, ‘shinobi’ failed. The problem seems to be IO since it is in the ‘connecting’ state. The detailed message indicates that the connection to the master failed but is in retry mode. No error messages on the SQL state since the problem does not relate to it. If it was, additional messages on the SQL cause would be given.
Step 3: restore ‘shinobi’ database Remove the ignore-flag for mysqld or start the database directly.
If you leave the ignore-flag, the warning will persist.
Immediately the master/slave connections on the IO and SQL levels are reestablished. The active database for ‘shinobi’ remains ‘kunoichi’ however. Shinobi status:
Kunoichi status:
After about a minute (or more if a lot of data needs to be synced), the ‘shinobi’ report shows that the current database is once again ‘shinobi’ and the Primary is Active.
Note: During the database re-synchronization phase the active licenses may show a warning because license validation occurs only at large intervals. This situation will correct itself and has no repercussions because licenses are never hard enforced.
Filesystems
The size and usage of the various filesystems mounted by the server are listed. It is the output of the command df -h.
Process list
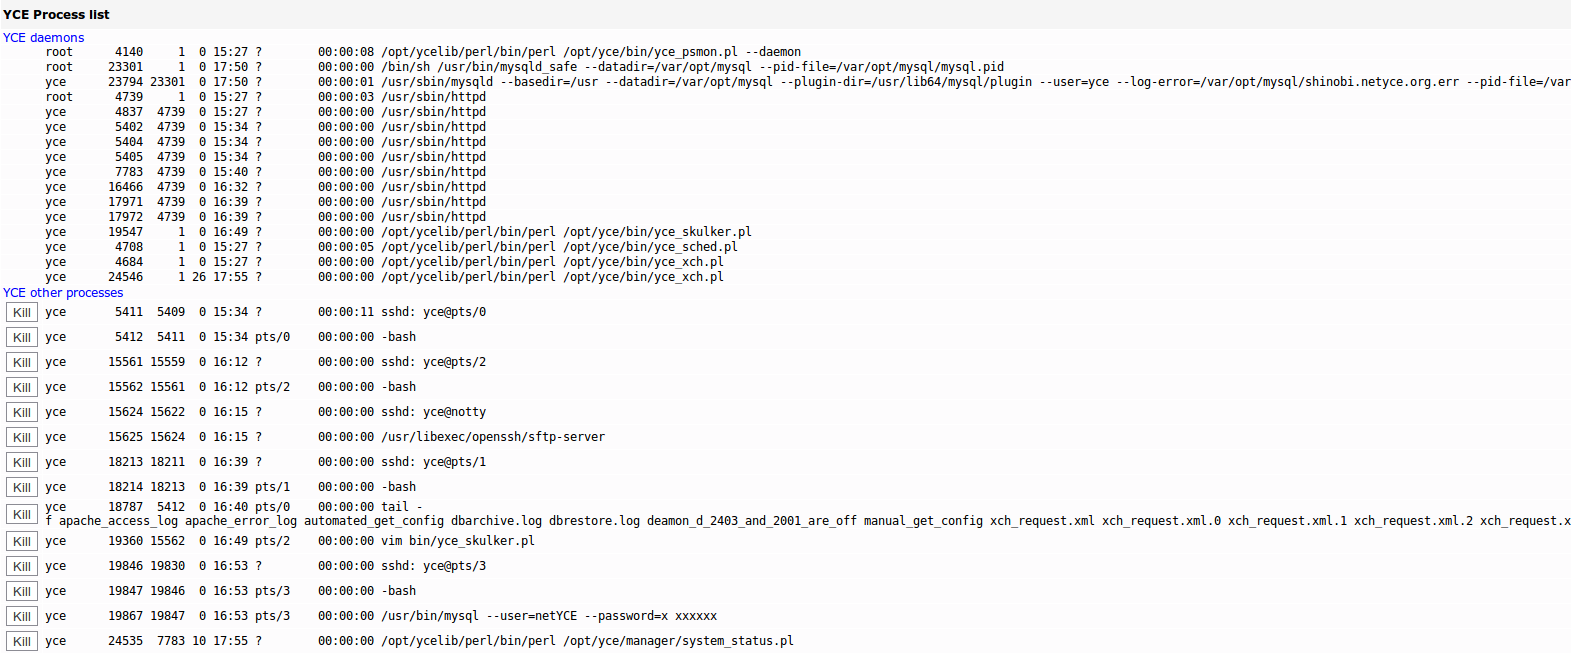
The YCE process list reports the process table of all YCE related processes. The top subsection all YCE daemon processes and their siblings. The bottom subsection all remaining ‘yce’-owned processes as well
YCE usage
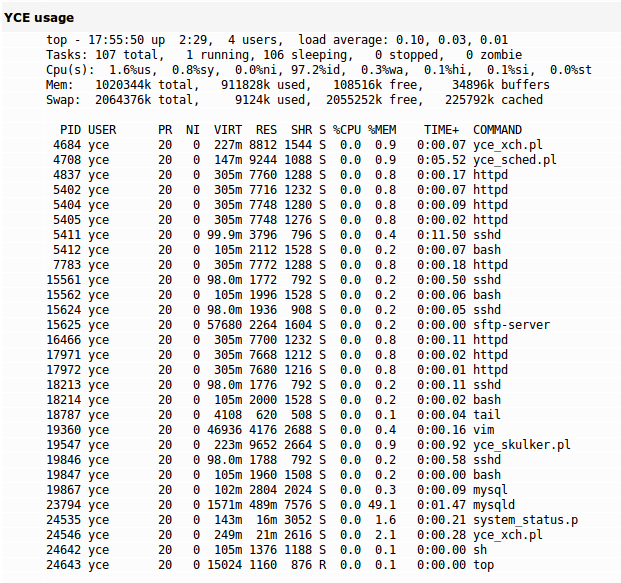
The YCE usage section shows a snapshot of the most active processes of the ‘yce’ user. The output of the command top -b -n 1 -u yce is listed
Wiki updates
The NetYCE WIKI installation consists of two parts. The DokuWiki engine setup for NetYCE wiki's and the actual Wiki content. Both can be downloaded from this page and are daily updated. Normally, only the Wiki content part needs to be regularly downloaded and installed on your local YCE-server(s).
these NetYCE wiki installation distribution files can be installed using the NetYCE web-based front-end using the Admin - System - System status page. After requesting the full report, locate the “Install Wiki distribution” button and click the Choose file button next to it. Select the downloaded file and confirm (or drag it onto the Choose file button). Then click the Install Wiki distribution button.
Both parts need to be installed this way.
NOTE
This front-end functionality is not yet available in the current releases. Within a few days the Wiki installation option, the URL configuration and the http-server setup options - required to access the Wiki - will become available in a NetYCE patch update. Alternatively, the manual process described on Download WIKI installation files can be used.

